SS&C Technologies Faces Unfavorable Operating Environment (NASDAQ:SSNC) – Seeking Alpha

Jirapong Manustrong
Jirapong Manustrong
SS&C Technologies (NASDAQ:SSNC) reported its Q2 2022 financial results on July 27, 2022, missing expected revenue and EPS estimates.
The company provides a range of software solutions for financial services firms and healthcare companies worldwide.
SSNC has been an active acquirer and may find some bargains in the coming quarters, but results may continue to remain lackluster as organic revenue is pressured, costs remain high and earnings disappoint.
So, I’m on Hold for SSNC in the near term.
Windsor, Connecticut-based SS&C Technologies was founded in 1986 to provide automation software for a variety of institutional financial and healthcare system processes.
The firm is headed by founder, Chairman and Chief Executive Officer Bill Stone, who was previously a Senior Management Consultant at KPMG and Vice President at Advest.
The company’s primary offerings include:
GlobeOp
Singularity
Global Wealth Platform
Sightline
Vision FI
Risk & Compliance
Chorus
Learning Institute
Real Asset Services
Blue Sky Administration
Others
The company acquires customers through its direct sales and marketing efforts as well as through partner referrals.
SS&C has offices in the Americas, Europe and Asia.
According to a 2019 market research report by Grand View Research, the global wealth management software market is forecasted to reach $5.8 billion by 2025.
This represents a strong CAGR (Compound Annual Growth Rate) of 15.3% from 2019 through 2025.
The main drivers for this expected growth include an increasing need for digital automation tools and improved engagement by providing ‘omnichannel access and an open architecture.’
Major industry participants include:
Fiserv
Temenos
Fidelity National Information Services
Profile Software
SEI Investments
Comarch SA
Objectway S.p.A.
Dorsum
The company also operates in other financial services and healthcare software solutions markets, each of which are multi-billion dollar markets.
Total revenue by quarter has risen according to the following chart:
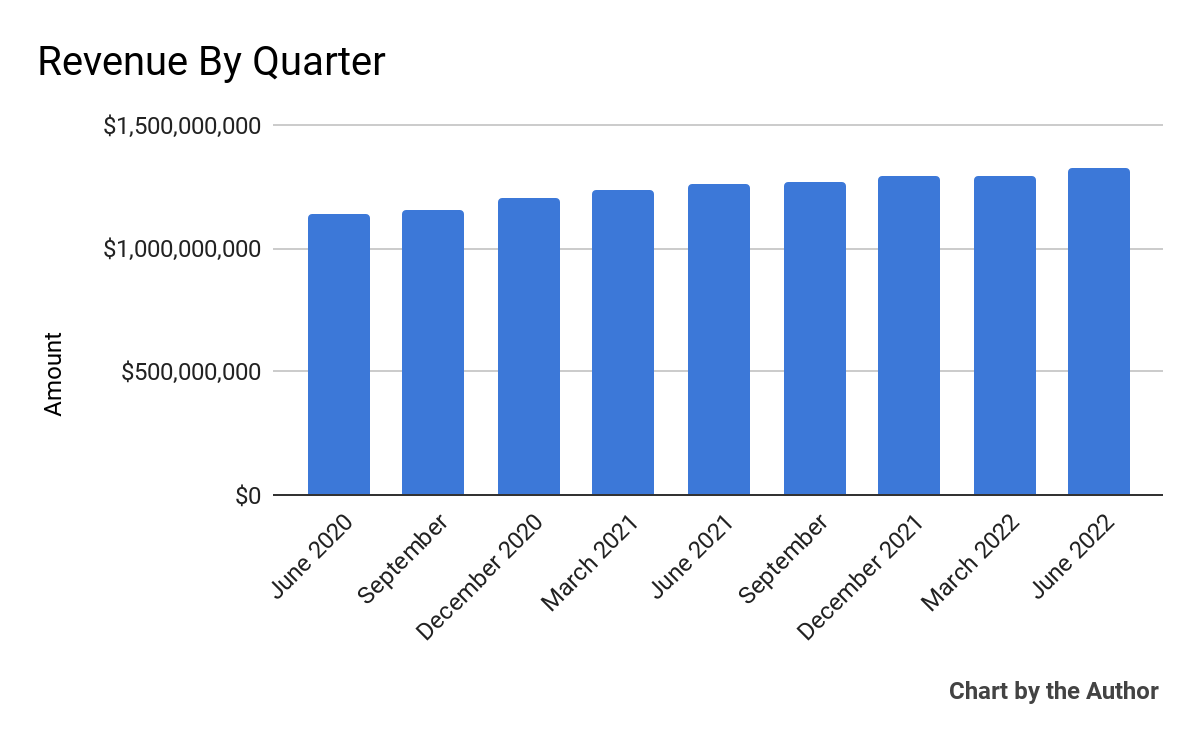
9 Quarter Total Revenue (Seeking Alpha)
9 Quarter Total Revenue (Seeking Alpha)
Gross profit by quarter has grown steadily:
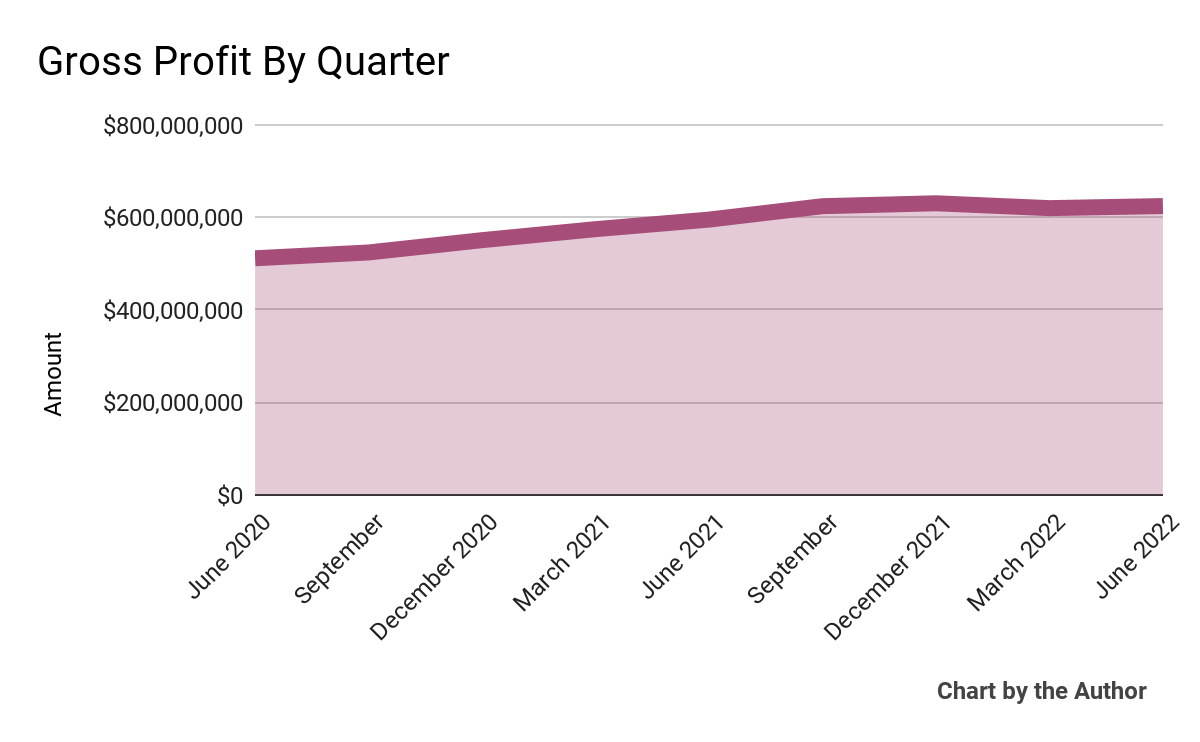
9 Quarter Gross Profit (Seeking Alpha)
9 Quarter Gross Profit (Seeking Alpha)
Selling, G&A expenses as a percentage of total revenue by quarter have risen sharply in the most recent quarter:
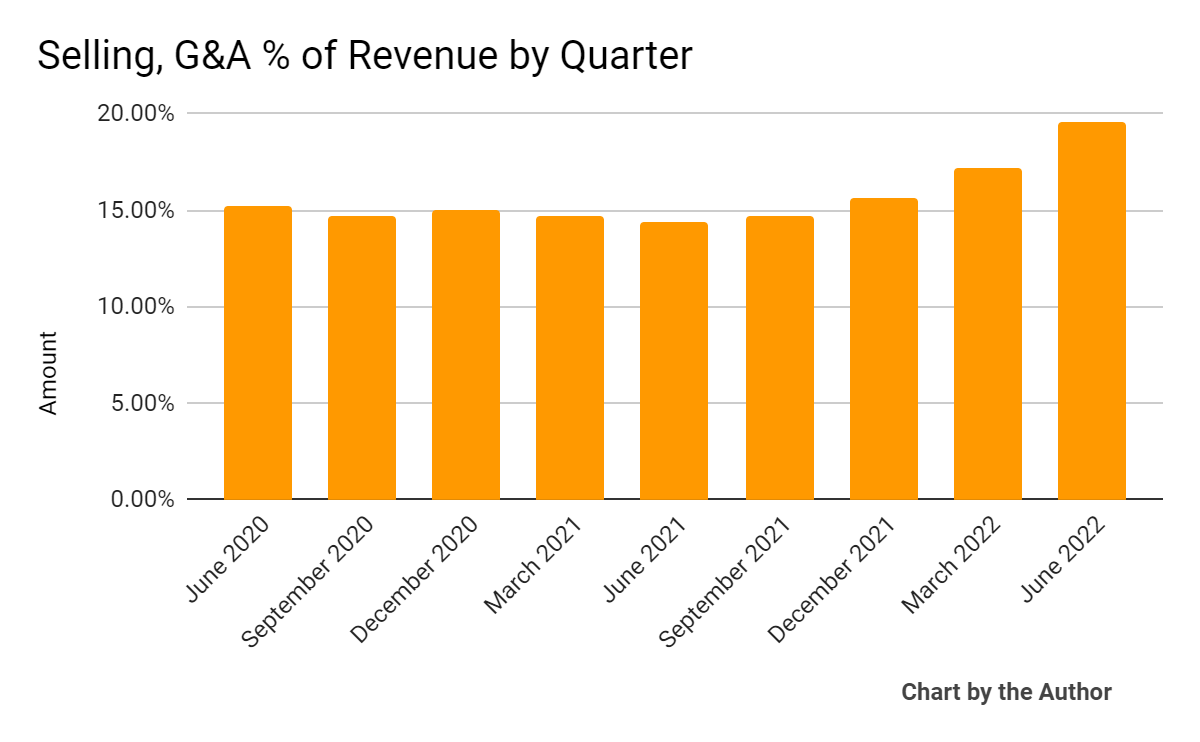
9 Quarter Selling, G&A % Of Revenue (Seeking Alpha)
9 Quarter Selling, G&A % Of Revenue (Seeking Alpha)
Operating income by quarter has dropped in recent reporting periods:
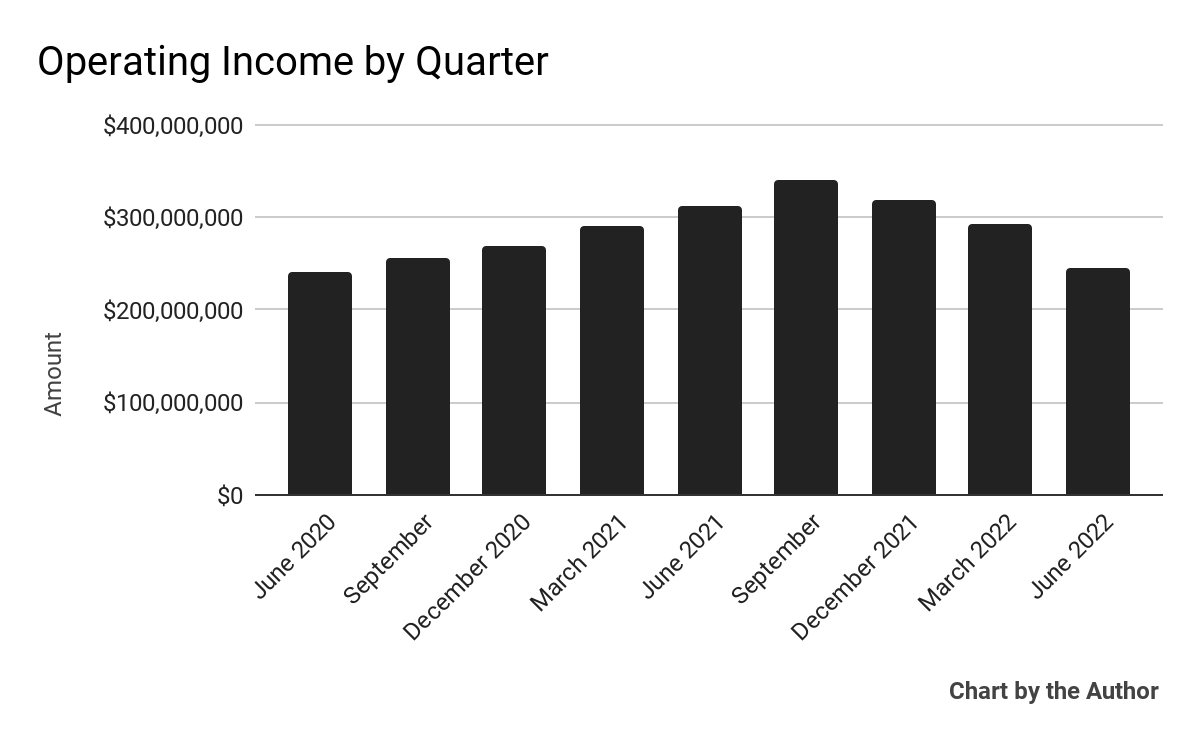
9 Quarter Operating Income (Seeking Alpha)
9 Quarter Operating Income (Seeking Alpha)
Earnings per share (Diluted) have also fallen materially in recent quarters:
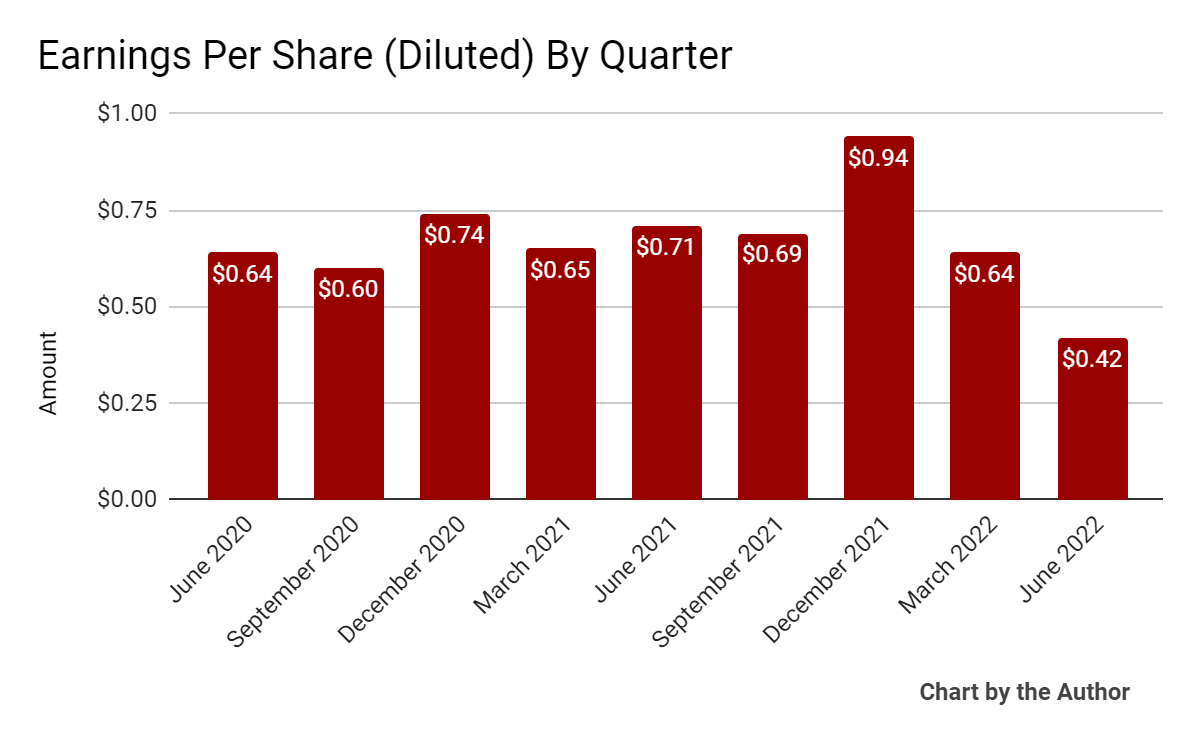
9 Quarter Earnings Per Share (Seeking Alpha)
9 Quarter Earnings Per Share (Seeking Alpha)
(All data in above charts is GAAP)
In the past 12 months, SSNC’s stock price has fallen 26.3% vs. the U.S. S&P 500 index’ drop of around 13.5%, as the chart below indicates:
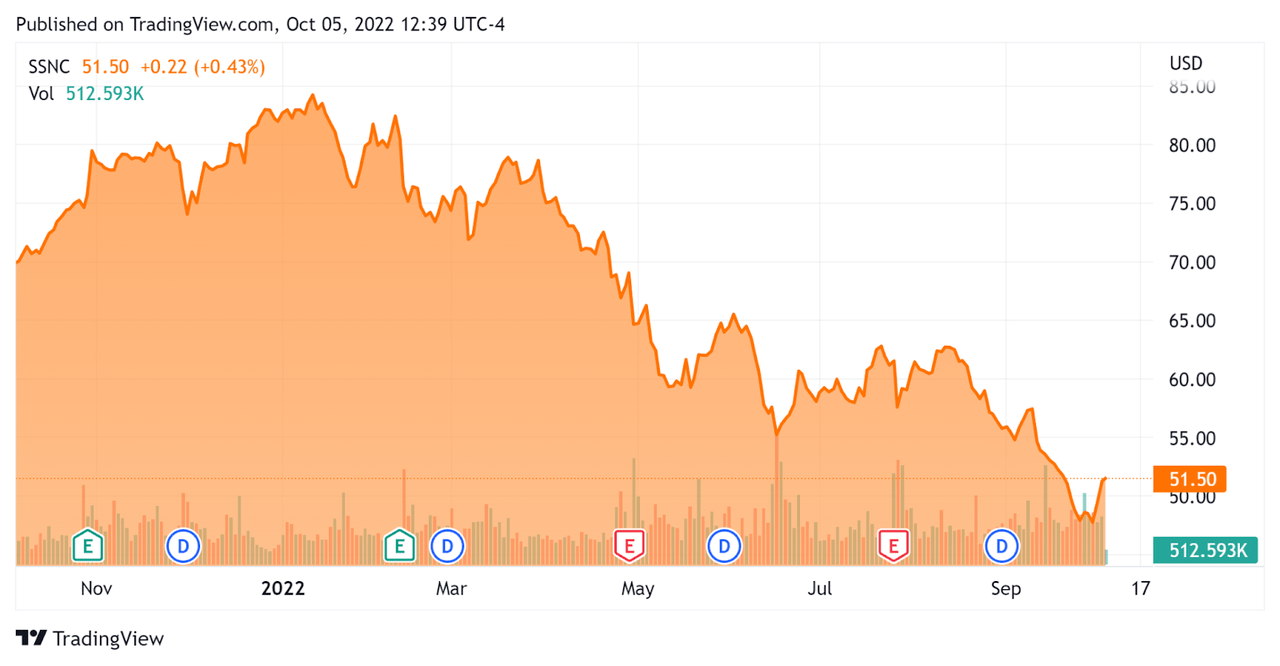
52 Week Stock Price (Seeking Alpha)
52 Week Stock Price (Seeking Alpha)
Below is a table of relevant capitalization and valuation figures for the company:
Measure [TTM]
Amount
Enterprise Value / Sales
3.81
Revenue Growth Rate
6.9%
Net Income Margin
13.9%
GAAP EBITDA %
34.8%
Market Capitalization
$12,610,000,000
Enterprise Value
$19,750,000,000
Operating Cash Flow
$1,310,000,000
Earnings Per Share (Fully Diluted)
$2.69
(Source – Seeking Alpha)
As a reference, a relevant partial public comparable would be Fiserv (FISV); shown below is a comparison of their primary valuation metrics:
Metric
Fiserv
SS&C
Variance
Enterprise Value / Sales
4.72
3.81
-19.3%
Revenue Growth Rate
10.3%
6.9%
-33.0%
Net Income Margin
11.9%
13.9%
16.2%
Operating Cash Flow
$3,830,000,000
$1,310,000,000
-65.8%
(Source – Seeking Alpha)
A full comparison of the two companies’ performance metrics may be viewed here.
The Rule of 40 is a software industry rule of thumb that says that as long as the combined revenue growth rate and EBITDA percentage rate equal or exceed 40%, the firm is on an acceptable growth/EBITDA trajectory.
SSNC’s most recent GAAP Rule of 40 calculation was 41.7% as of Q2 2022, so the firm has performed well in this regard, per the table below:
Rule of 40 – GAAP
Calculation
Recent Rev. Growth %
6.9%
GAAP EBITDA %
34.8%
Total
41.7%
(Source – Seeking Alpha)
In its last earnings call (Source – Seeking Alpha), covering Q2 2022’s results, management noted the effects of higher labor costs, interest rates, foreign exchange headwinds, and a slower economic environment as pressuring its results.
The firm did see growth from its Alternatives, Intralinks, and Advent offerings but has challenges in its health care offerings as it continues to invest in its DomaniRx product, a cloud-based claims adjudication platform for pharmacy benefits management use cases.
As to its financial results, adjusted revenue rose 5.5% year-over-year, while adjusted diluted EPS dropped 11%.
Management did not disclose any retention rates for customers or sales figures.
SSNC’s Rule of 40 results have been impressive as of its most recent quarterly results.
However, its Financial Services business has been taking the lion’s share of negative results due to a strong dollar against European and other currencies, and management expects that to continue in the 2nd half of 2022.
SG&A expenses as a percentage of total revenue have risen materially in recent quarters, but management says it is ‘tightly controlling our cost for the remainder of the year. Real estate reductions, IT spending, and implementing Blue Prism’s digital workers throughout our operations will drive our margins back up to historical levels exiting the year.’
For the balance sheet, the firm finished the quarter with $438.3 million in cash and equivalents and $7.23 billion in long-term debt. Over the trailing twelve months, free cash flow was $1.26 billion.
The company paid nearly $1.6 billion for acquisitions in the first half of the year and stopped stock repurchases in Q2 due to an expected M&A deal that didn’t materialize.
Looking ahead, management expects adjusted organic growth of between 0.6% and 4.8% and operating cash flow of around $1.2 billion, both for the full year.
Regarding valuation, the market is currently valuing SSNC at a lower EV/Sales multiple than Fiserv.
The primary risk to the company’s outlook is a continuation of the challenges it is currently facing, namely an unfavorable economic environment, slowing sales cycles, higher interest rates causing foreign exchange headwinds due to a strong dollar, higher labor costs, and elevated cost of capital.
A reversal or pause by the U.S. Federal Reserve would likely help indebted companies like SSNC that also have significant FX exposure.
However, while SSNC has been an active acquirer and may find some bargains in the coming quarters, results may continue to remain lackluster as organic revenue is pressured, costs remain high, and earnings results disappoint.
So, I’m on Hold for SSNC in the near term.
Gain Insight and actionable information on U.S. IPOs with IPO Edge research.
Members of IPO Edge get the latest IPO research, news, and industry analysis.
Get started with a free trial!
This article was written by
I’m the founder of IPO Edge on Seeking Alpha, a research service for investors interested in IPOs on US markets. Subscribers receive access to my proprietary research, valuation, data, commentary, opinions, and chat on U.S. IPOs. Join now to get an insider’s ‘edge’ on new issues coming to market, both before and after the IPO. Start with a 14-day Free Trial.
Disclosure: I/we have no stock, option or similar derivative position in any of the companies mentioned, and no plans to initiate any such positions within the next 72 hours. I wrote this article myself, and it expresses my own opinions. I am not receiving compensation for it (other than from Seeking Alpha). I have no business relationship with any company whose stock is mentioned in this article.
Additional disclosure: This report is for educational purposes only and is not financial, legal or investment advice. The information referenced or contained herein may change, be in error, become outdated and irrelevant, or removed at any time without notice. You should perform your own research for your particular financial situation before making any decisions.